Hyperspectral Feature Engineering
This page explains how hyperspectral image cubes were converted into vegetation indices, spectral features, and structured outputs for plant health analysis.
Hyperspectral Sample
Hyperspectral imaging captures plant information across many wavelength bands, not just normal visible color. This allows the pipeline to study plant response using spectral patterns that may not be obvious in standard RGB images.
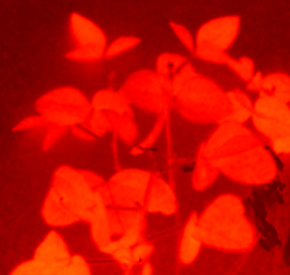
Hyperspectral Image Example
Example hyperspectral image used to analyze plant response across wavelength bands.
Feature Engineering Goal
The hyperspectral feature engineering workflow uses wavelength information to describe plant condition beyond normal RGB color. Each hyperspectral image contains many spectral bands, so the pipeline extracts vegetation indices and spectral measurements that can help show changes in plant health.
Spectral Bands
Valid hyperspectral TIFF cubes were checked for the expected 51 band structure before feature extraction.
Vegetation Indices
The workflow computed NDVI, GNDVI, red edge NDVI, chlorophyll red edge, and simple ratio.
Timestamped Records
The feature engineering workflow produced structured timestamped records for analysis over time.
Vegetation Index Features
Vegetation indices combine selected wavelength bands to highlight plant traits such as greenness, chlorophyll response, and red edge behavior. These indices help turn hyperspectral images into numerical features that can be analyzed over time.
NDVI
Uses red and near infrared response to estimate vegetation strength and plant greenness.
GNDVI
Uses green and near infrared bands to capture greenness and chlorophyll related changes.
Red Edge NDVI
Uses red edge wavelengths to capture plant changes that may not be clear in RGB images.
Chlorophyll Red Edge
Uses red edge behavior to support chlorophyll related analysis.
Simple Ratio
Uses a ratio between selected spectral bands to summarize plant reflectance response.
Vegetation Index Maps
This visual shows the main hyperspectral vegetation indices extracted from the image and compares their distributions and mean values.
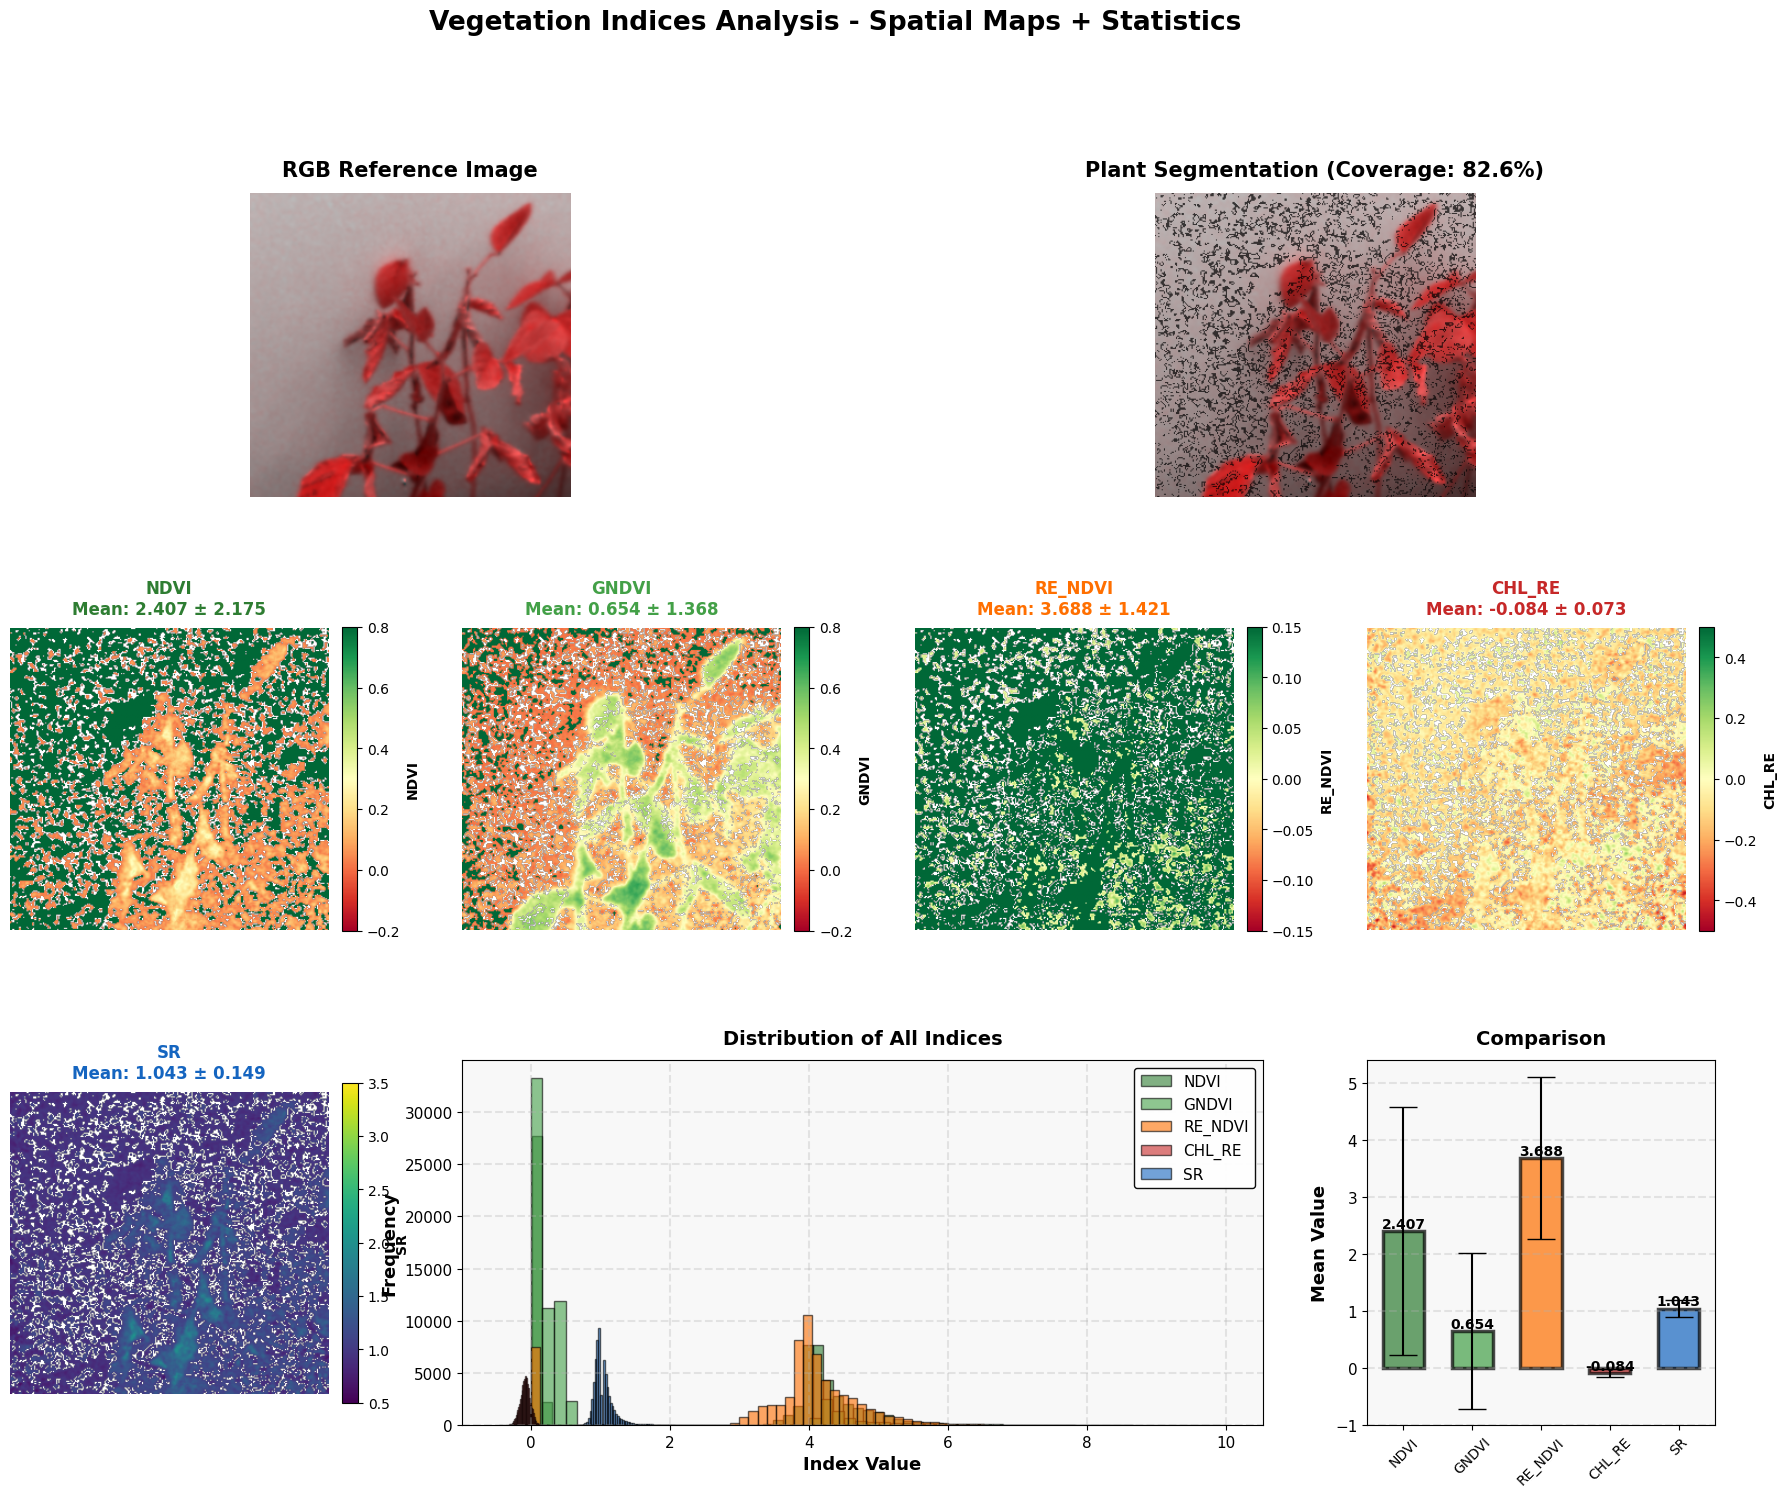
Vegetation Indices Analysis
NDVI, GNDVI, red edge NDVI, chlorophyll red edge, and simple ratio were mapped spatially to show how different spectral features respond across plant pixels.
Spectral Band Progression
Hyperspectral imaging captures the same plant across many wavelengths. This visual shows how plant appearance changes as the wavelength increases from lower visible bands toward near infrared bands.
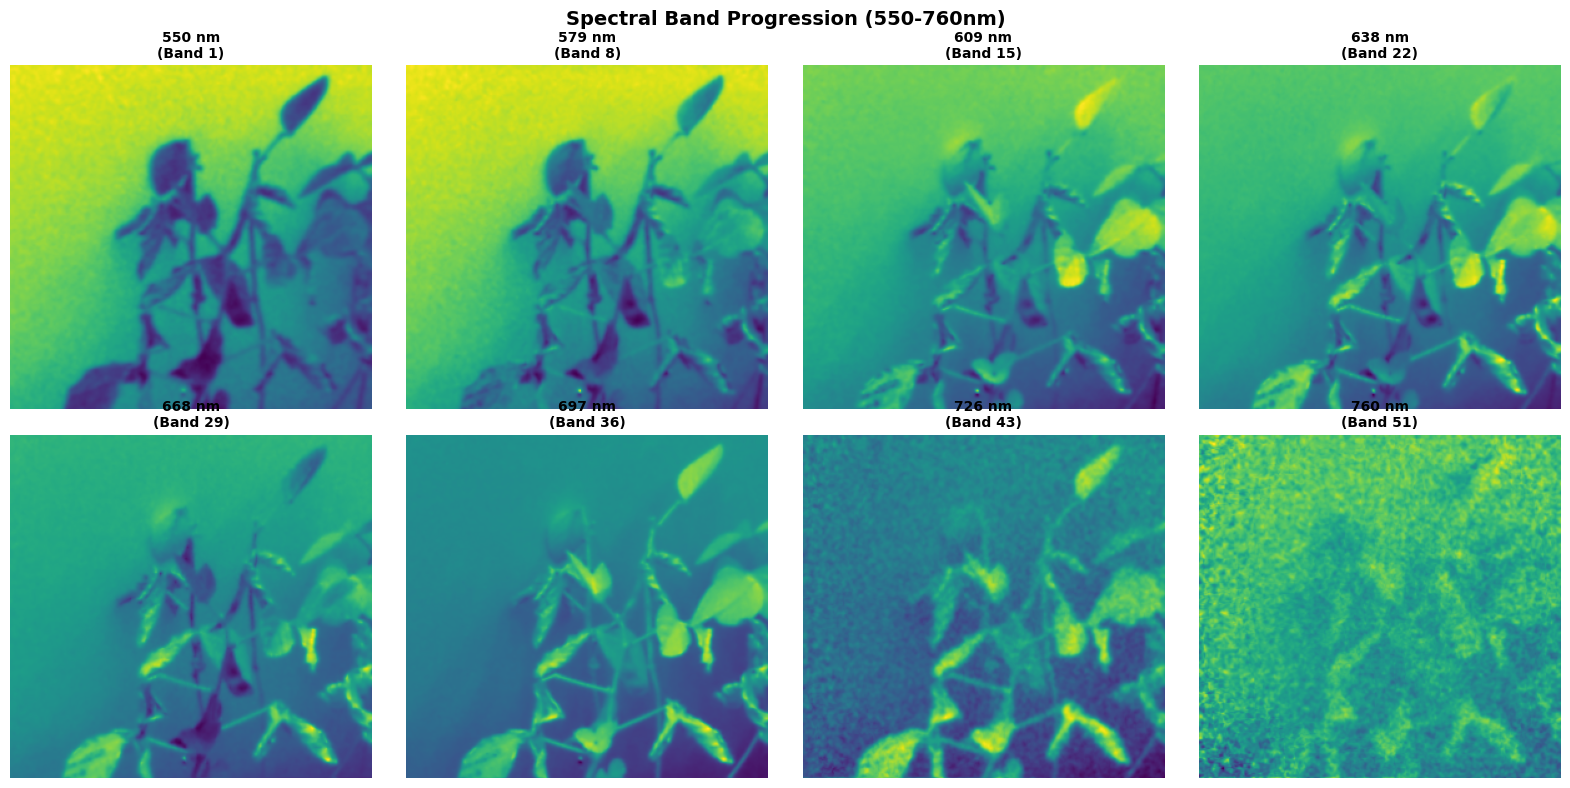
Spectral Band Progression
The same plant scene is shown across selected wavelength bands, helping illustrate why hyperspectral data contains more information than a standard RGB image.
Plant Spectral Signature
The spectral signature summarizes how plant pixels respond across wavelengths. This helps show which wavelength regions were important for the vegetation indices used in the pipeline.
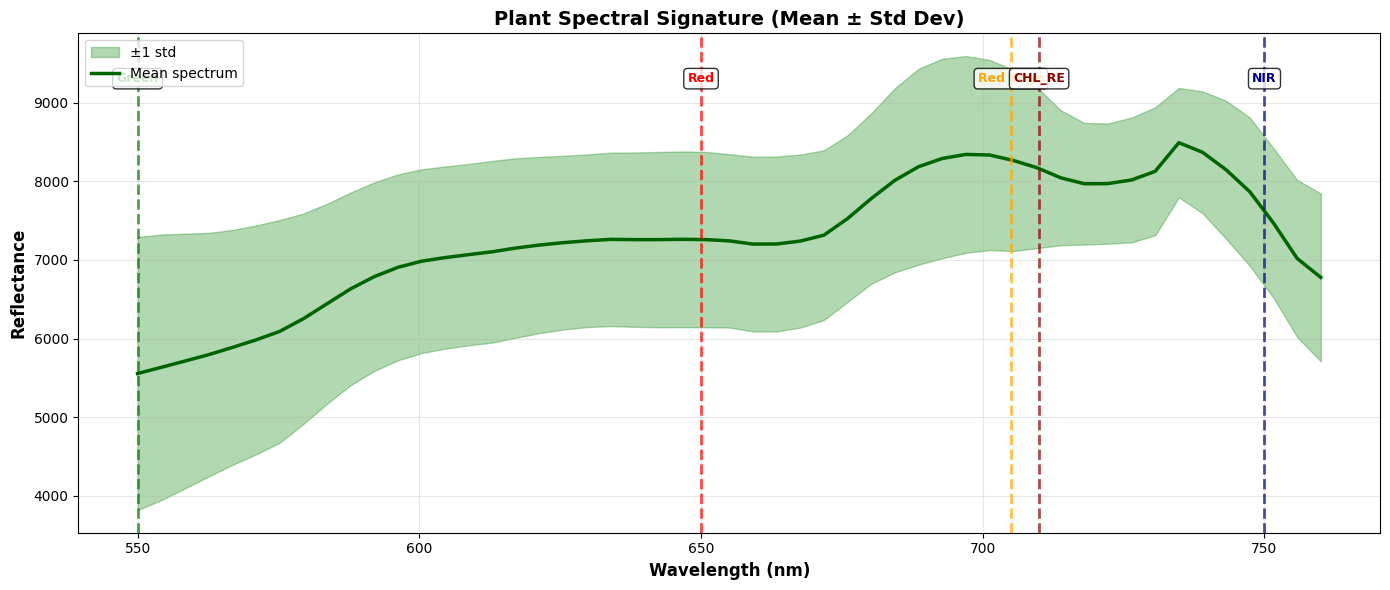
Plant Spectral Signature
The mean plant spectrum shows reflectance patterns across wavelength bands, with key regions marked for red, red edge, chlorophyll red edge, and near infrared measurements.
Feature Output
The output of the hyperspectral feature engineering workflow is a structured feature table. Each timestamped record contains vegetation index values and related metadata that can be used for analysis, visualization, and future fusion with RGB and depth features.
These features were useful for understanding hyperspectral plant response and can support future model fusion with RealSense RGB and depth features.
Why Hyperspectral Features Matter
RGB images only show visible color, but hyperspectral images capture plant response across many wavelengths. This makes hyperspectral features useful for detecting subtle plant changes that may appear before symptoms are obvious in standard images.
← Back to Home