Dataset
The Astro Cultivators dataset combines RGB, depth, and hyperspectral imaging to monitor soybean growth and drought stress in controlled chamber experiments.
Dataset Overview
The project uses multiple imaging sources so plant health can be studied from more than one view. RGB images capture visible color and shape, depth images support structure and height related measurements, and hyperspectral images capture wavelength based plant response.
Image Modalities
RGB, depth, and hyperspectral data are used together to support plant stress analysis.
HS Bands
Hyperspectral TIFF files were filtered to keep valid 51 band images for consistent analysis.
Main Light Window
Most processing focused on the grow light window so image quality and lighting were more consistent.
Sample Image Modalities
These examples show the three main types of imaging data used in the project.
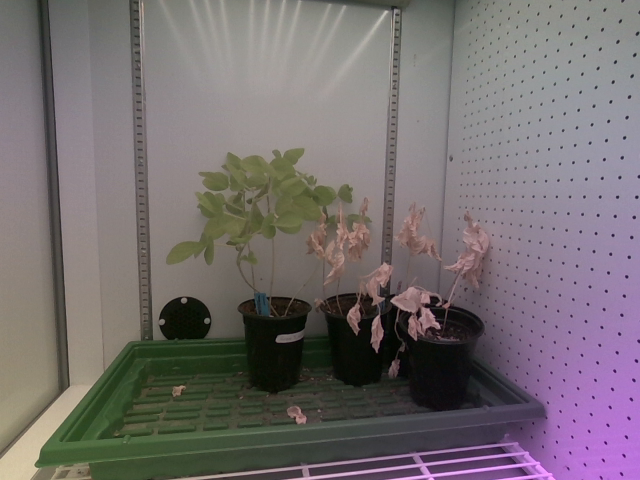
RGB Image
Used for visible plant color, segmentation, VARI, area, and growth related traits.
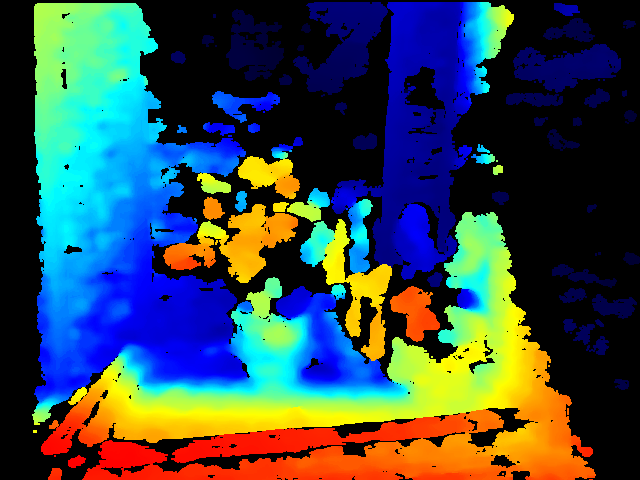
Depth Image
Used to support structure based features such as height, depth variation, and canopy shape.
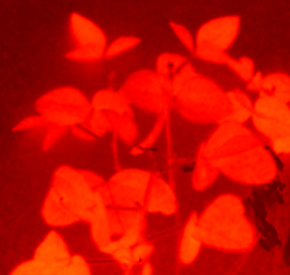
Hyperspectral Image
Used to compute vegetation indices and capture plant responses beyond normal RGB color.
Imaging Modalities
RGB Images
RGB images from the Intel RealSense camera were used to segment visible plant regions and compute visible growth features such as area, height, and VARI.
Depth Images
Raw depth data was used to explore plant structure features such as depth standard deviation, surface roughness, canopy volume, and vertical spread.
Hyperspectral Images
Hyperspectral TIFF cubes were used to measure plant response across wavelength bands and compute vegetation indices such as NDVI, GNDVI, red edge NDVI, chlorophyll red edge, and simple ratio.
Experiment Sets
The dataset includes calibration work and drought stress experiments. The experiment log includes chamber settings, sensor use, watering schedules, plant dates, and notes about data quality.
| Plant Set | Sensor Type | Lighting | Experiment Type | Notes |
|---|---|---|---|---|
| Calibration Cycle 1 | Hyperspectral | Night mode setup | Camera setup and calibration | Messy early data with gaps. Not used for stress detection. |
| Calibration Cycle 2 | Hyperspectral | Night mode setup | Cleaner calibration data | Used for hyperspectral preprocessing and vegetation index feature engineering. |
| Set 1 | Hyperspectral and RealSense | 7 hour photoperiod | Drought experiment | Included control and drought plants. RealSense data had timing drift and quality issues. |
| Set 2 | Hyperspectral and RealSense | 6 AM to 1 PM | Best dataset for final modeling | Included one control plant on the left and one drought plant on the right. Used for final RealSense stress detection modeling. |
| Set 3 | Hyperspectral and RealSense expected | 6 AM to 4 PM | Current or incomplete | Still needed clarification and complete data before final analysis. |
Set 2 Dataset
Set 2 was the strongest dataset for final RealSense analysis because it had a cleaner imaging window and clear control versus drought setup.
Usable Frames
Usable RealSense frames were identified after manual review, filtering, and segmentation checks.
Days
The final RealSense workflow used daily aggregated data across 20 days.
Treatments
The left plant was control and the right plant was drought.
Hyperspectral Dataset Details
The hyperspectral preprocessing work cleaned raw TIFF files, validated 51 band cube structure, removed invalid frames, created NDVI masks, and saved vegetation related metadata.
RealSense Dataset Details
The RealSense workflow used RGB and raw depth images from the Intel RealSense D435 camera. RGB images supported segmentation and color based features, while depth images supported structure based plant traits.
Dataset Limitations
- Some images were removed because they were outside the lights on window, corrupted, too dim, or not usable for feature extraction.
- Some hyperspectral data was useful for preprocessing and feature extraction but was not fully fused into the final RealSense classifier.
- Set 2 was the strongest dataset, but the final model still needs validation on more plant sets.
- Intermediate manual measurements such as ruler based height and leaf area were not fully available for all image dates.
Data Infrastructure
The notebooks use Python, NumPy, Pandas, tifffile, OpenCV, Matplotlib, SciPy, scikit image, PyTorch, Grounded SAM 2, SAM 2.1, and scikit learn to organize files, load images, filter invalid data, calculate features, and export CSV outputs.
← Back to Home